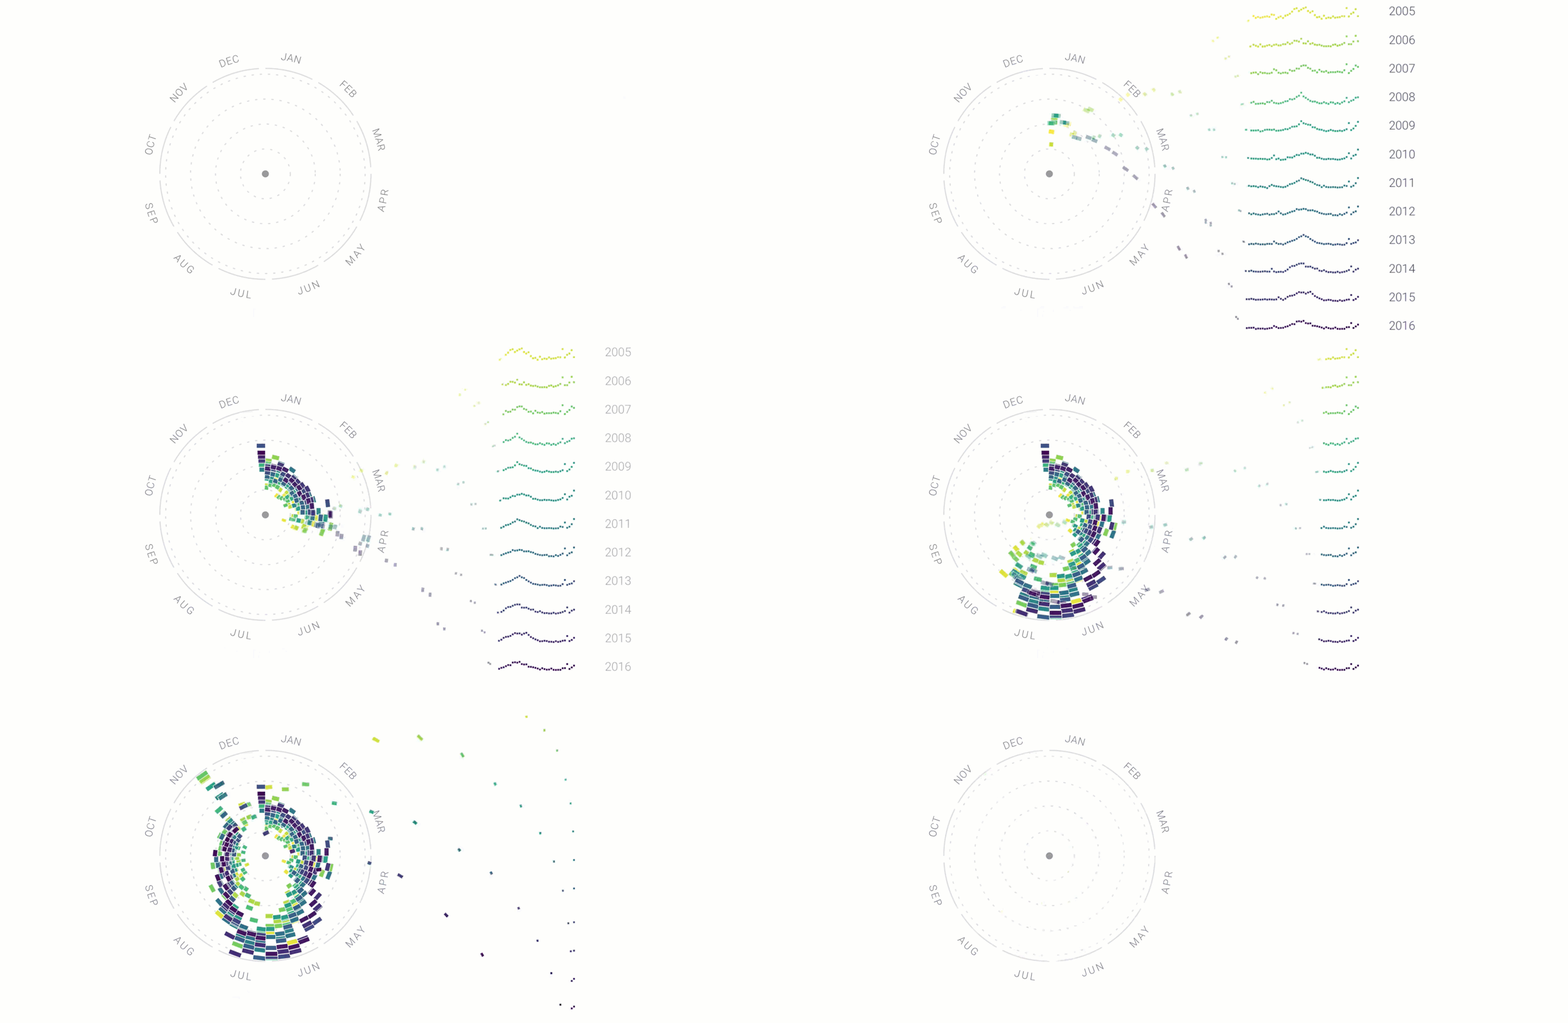
Google News Lab and Truth & Beauty
The volume and complexity of data continues to increase in the world around us, including science, business, medicine, social media and everyday human activity. This course aims to expose students to visual representation methods and techniques that increase the understanding of complex data. Good visualizations not only present a visual interpretation of data, but do so by improving comprehension, communication, and decision making.
In this course, students will learn about the fundamentals of perception, the theory of visualization, good design practices for visualization, and how to develop web-based visualizations using HTML5, CSS, JavaScript, SVG, and D3.
The course begins by bootstrapping web development skills, moves on to fundamentals of perception, introduces common data types, and then focuses on visualization techniques and methods for a broad range of data.
Instructor
Course Sessions
Lectures & Labs: Monday and Wednesday 12:00-1:20 pm, Location: GHC 4301
Office Hours:
TBD

